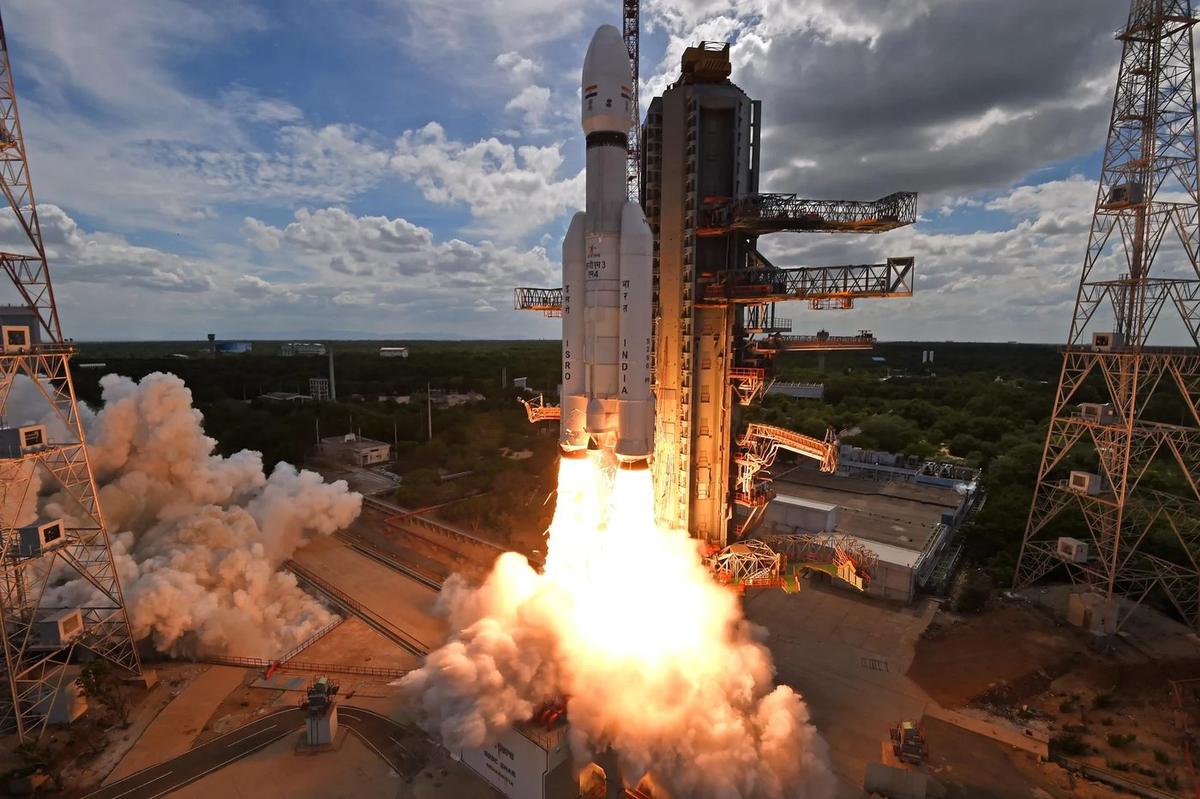
Photo: LVM3 launch, Sriharikota, ISRO, GODL-India

APPSC Group-I Mains 2025 · Paper V
2025 Paper V · Q11(b): model answer
Science, Technology & Environmental Issues · Pollution, waste and climate change. Held in May 2025 (Notification 12/2023).
Discuss the role of remote sensing in tracking the dispersion of environmental pollutants. Analyze its implications for human health in affected regions, highlighting limitations and future improvements.
Syllabus: Pollution, waste and climate change · Pollution and waste management
Remote sensingPollutant dispersionAerosol optical depthExposure mapping
Remote sensing means gathering information about the Earth from satellites, aircraft or drones by measuring reflected or emitted radiation. Gases such as nitrogen dioxide, sulphur dioxide and ozone, and particles (aerosols), absorb or scatter particular wavelengths, so sensors can map their amounts and follow pollutant plumes from fires, factories and cities across regions and borders, something scattered ground monitors cannot do.
1. Tracking dispersion from space
- Gases: ESA's Sentinel-5P (TROPOMI, 2017) maps NO₂, SO₂, CO, ozone, formaldehyde and methane every day at a few kilometres' resolution; it showed NO₂ falling sharply over Indian cities during the 2020 lockdown.
- Aerosols and smoke: the US MODIS and VIIRS sensors and ISRO's INSAT-3D/3DR give aerosol optical depth and fire counts; IARI's CREAMS laboratory uses such data to count paddy-residue fires in Punjab, Haryana and Uttar Pradesh as smoke drifts towards Delhi.
- Water and coasts: ocean-colour sensors (Oceansat-3) detect algal blooms and sediment plumes, and radar satellites spot oil slicks even through clouds.
- Greenhouse gases: methane plumes from landfills, coal mines and gas leaks can now be detected from space, helping target controls.
2. Implications for human health
- Exposure maps: satellite-based PM2.5 estimates, calibrated with ground monitors, cover rural areas and small towns without monitors; the ICMR-led study (Lancet Planetary Health, 2020) that linked about 16.7 lakh deaths in 2019 to air pollution used such satellite-based exposure estimates.
- Source attribution: tracing stubble smoke, power-plant SO₂ and dust storms shows who is exposed and supports regional airshed action instead of city-only plans.
- Early warning: plume forecasts allow health advisories, school closures and curbs on construction (as under GRAP in Delhi-NCR), protecting children, the elderly and heart and lung patients.
- Epidemiology: linking maps to hospital data reveals pollution-related asthma, pneumonia, heart disease and low birth weight; bloom maps protect fishers and drinking-water intakes.
- Vulnerable groups: overlaying plume maps on population data shows which slums, schools and hospitals lie in the worst-affected zones, so that protection and clean-air measures can be targeted there first.
3. Limitations and future improvements
| Limitation | Future improvement |
|---|---|
| Measures the whole air column, not the air people breathe | Fusion with ground data, models and AI to estimate surface PM2.5 |
| Clouds, monsoon haze and night block optical sensors | Geostationary sensors with hourly data (Korea's GEMS, 2020; NASA's TEMPO, 2023) |
| Kilometre-scale pixels miss street-level hotspots | High-resolution and hyperspectral sensors, drones, low-cost sensor networks |
| Many toxics are invisible (styrene, heavy metals, microbes) | Ground sensors and continuous emission monitoring near industries |
| Local bodies rarely use the data | Open dashboards, training, Indian products via ISRO's MOSDAC and Bhuvan |
AP angle: Visakhapatnam and Vijayawada are among AP's NCAP non-attainment cities; satellites can map their aerosol and NO₂ plumes, but the LG Polymers styrene leak (2020) shows why sensors around factories remain essential.
Remote sensing turns pollution from a point reading into a regional picture; combined with ground networks, AI models and geostationary satellites, it can drive health-based air-quality management.
The other choice in Q11
Answer either one in the exam.
- Q11(a)Define global warming, and differentiate it clearly from climate change. Explain the key natural and human-induced causes of global warming and briefly discuss which factors are currently dominant in driving global temperature rise.
10 marks · Pollution, waste and climate change · Climate change and sustainable development
Every model answer on these pages is free to read. The Tool Kit adds four PDF books for Mains Papers I–IV: every previous question sorted by syllabus, with practice questions. It is in the ₹149 All-in-One Pass, with every previous paper of every exam on the site, practice quizzes, timed tests, mock test series and study books.
₹149 · valid for 12 months from the day you pay, on every exam · pay by UPI, card or net banking