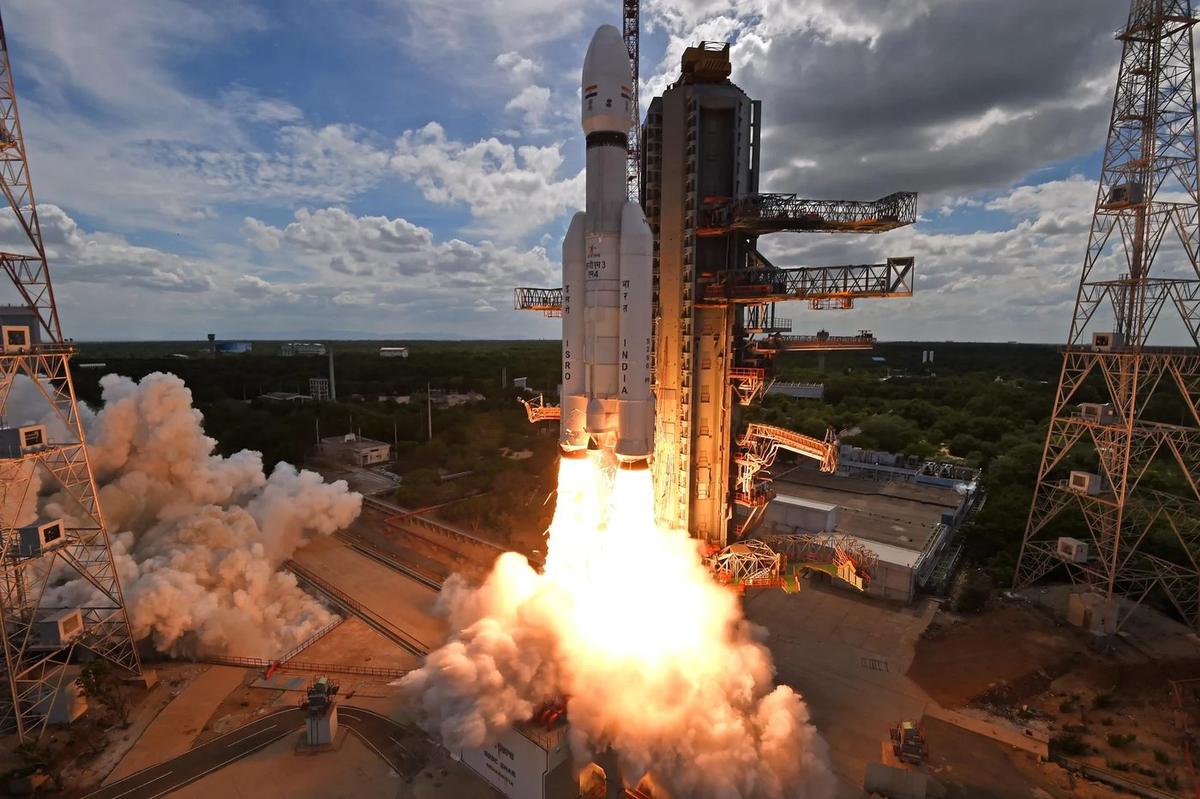
Photo: LVM3 launch, Sriharikota, ISRO, GODL-India

APPSC Group-I Mains 2020 · Paper V
2020 Paper V · Q10(a): model answer
Science, Technology & Environmental Issues · Energy: conventional and renewable. Held in December 2020 (Notification 27/2018).
What is the status of utilization of Solar energy in India and the World? What are some factors hindering utilization of this green energy source?
Syllabus: Energy: conventional and renewable · Renewable energy
Solar energyInstalled capacityIntermittency and storageSupply-chain dependence
Solar energy is now the world's fastest-growing source of power. In 2025 the world added a record 511 GW of solar, about three-quarters of all new renewable capacity, taking global solar capacity to 2,391 GW (IRENA, 2026). India's solar capacity has grown from 2.82 GW in 2013-14 to 171 GW in September 2026, and India is now the third-largest country in installed solar capacity (IRENA, 2026).
1. Status in the world
- Scale: solar makes up nearly half of the world's 5,149 GW of renewable capacity (end of 2025); China alone holds about half of global solar capacity.
- Cost: module prices have fallen steeply, so solar is among the cheapest sources of new electricity in sunny regions.
- Cooperation: the International Solar Alliance (India and France, COP21, 2015; headquarters Gurugram) has over 120 member and signatory countries and aims at US$1 trillion of solar investment by 2030.
- Uneven spread: capacity is concentrated in China, the USA, Europe and India, while Africa, with the best sunshine, has very little.
2. Status in India
- Largest renewable source: solar is about 57% of India's 299 GW of renewable capacity, including 125.65 GW ground-mounted and 33.41 GW rooftop; Rajasthan leads (45.1 GW).
- Schemes: Solar Parks (40 GW target), PM-KUSUM for farmers (13.1 GW), PM Surya Ghar rooftop solar for 1 crore homes (over 50 lakh by August 2026), and PLI and ALMM for domestic manufacturing; module-making capacity rose from 2.3 GW (2014) to about 172 GW (March 2026).
- Targets: 500 GW of non-fossil capacity by 2030, against a solar potential of about 748 GWp (NISE).
3. Factors hindering its use
- Intermittency: solar works only by day, so solar and wind together gave only about 15% of electricity in 2025-26, although non-fossil sources are over half of capacity; the midday surplus and evening peak (the "duck curve") force curtailment.
- Storage and grid: batteries are still costly, and transmission lines lag behind new solar parks.
- Land and ecology: about 4–5 acres per MW; clashes with farmland and pastures; power lines kill the critically endangered Great Indian Bustard in Rajasthan and Gujarat.
- Finance: weak DISCOM finances delay payments; capital is costly in developing countries.
- Supply chain and upkeep: dependence on imported polysilicon and wafers, mainly from China (though module imports fell from about US$4.35 billion in 2023-24 to under US$1 billion in 2025-26); dust, heat and panel waste.
AP angle: under its Integrated Clean Energy Policy 2024, AP targets 78.5 GW of solar; it hosts the Ananthapuram-I (1,500 MW) and Kurnool (1,000 MW) solar parks and NTPC's floating solar plant at Simhadri.
Schematic map of Andhra Pradesh (2011 census district outlines), not to scale; for study only.
With storage, stronger grids and domestic manufacturing, solar can anchor India's energy transition and its 2030 and 2070 climate goals.
The other choice in Q10
Answer either one in the exam.
Every model answer on these pages is free to read. The Tool Kit adds four PDF books for Mains Papers I–IV: every previous question sorted by syllabus, with practice questions. It is in the ₹149 All-in-One Pass, with every previous paper of every exam on the site, practice quizzes, timed tests, mock test series and study books.
₹149 · valid for 12 months from the day you pay, on every exam · pay by UPI, card or net banking